LTV calculator. Retention, repeat, and the payback window.
Enter the four inputs that drive LTV. See gross LTV, contribution LTV, LTV:CAC ratio, and CAC payback months. Runs in your browser; nothing is saved.
Four numbers + your CAC.
LTV + payback.
Cumulative contribution margin per customer over the lifespan. The dashed line is CAC; the crossover is payback.
Retention is the curve behind every LTV number.
The simple LTV formula (AOV × frequency × lifespan) assumes uniform purchasing over a flat lifespan. The honest retention curve decays. Second-order retention (the percentage of first-time customers who place a second order within 180 days) is usually the single best predictor of LTV. DTC brands above 35 percent second-order retention ship with confidence; below 20 percent, retention work comes before acquisition scaling.
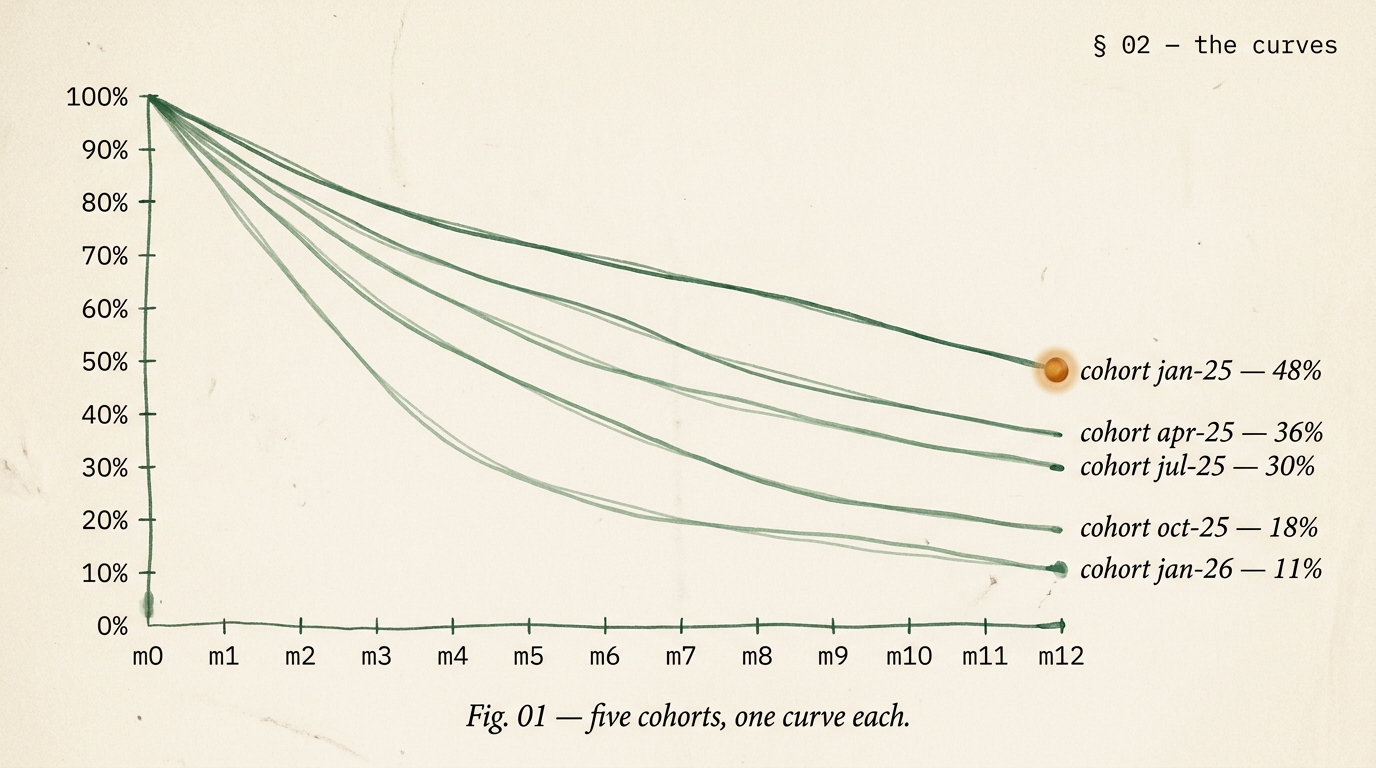
The calculator above produces a single LTV number from a single set of averages. The real shape is cohort retention. Every month, a new cohort of first-time buyers begins its decay curve. Watching the top three cohort curves together tells you whether retention is improving (the newer cohorts sit above the older ones) or declining (the newer cohorts sit below). For operators serious about unit economics, cohort retention charts matter more than the single-number LTV.
The second honest number is contribution LTV, not gross LTV. Contribution LTV is what you can reinvest in acquisition; gross LTV is a vanity metric. We use the tool above as a quick coarse estimate; for the engagement-level diagnostic we pull the last 24 months of cohort data from Shopify + BigQuery and fit the curve properly.
Five answers.
What is contribution LTV and why does it matter more than gross LTV?
Gross LTV is total revenue a customer generates over their lifespan. Contribution LTV is gross LTV times your contribution margin percentage, representing how much gross profit the customer actually contributes. Contribution LTV is what you can reinvest in acquisition. If your contribution margin is 40 percent, a $500 gross LTV customer is actually a $200 contribution LTV customer, and your acquisition cost ceiling is anchored to the $200 number, not the $500 one.
How long a customer lifespan should I model?
Use the period over which you have actual retention data. For most DTC brands, that is 12 to 24 months. Model longer only if you have genuine repeat-purchase data past that horizon. Modeling 36 or 60 months without evidence inflates LTV and underestimates how aggressively you need to keep acquiring. The honest number is usually the less flattering one.
What's a healthy LTV-to-CAC ratio?
On gross LTV, 3:1 is a common rule of thumb, meaning every acquisition dollar generates three dollars of gross lifetime revenue. On contribution LTV (the more honest frame), 3:1 is excellent and 2:1 is workable. Below 1.5:1 on contribution LTV is a sign the business cannot scale acquisition profitably and usually needs retention work before any new ad dollar makes sense.
What's CAC payback and why does it matter?
CAC payback is the number of months before a new customer's cumulative contribution covers the cost of acquiring them. Under 12 months is healthy; 6-9 months is strong. Payback matters more than raw LTV:CAC ratio for cash-flow planning because it tells you how long your working capital is exposed to each new customer before the acquisition pays for itself.
How do subscription brands measure LTV differently?
Subscription brands use retention-curve LTV instead of purchase-frequency LTV. The formula is more complex because each month's churn decision reduces the future payment stream geometrically. For a subscription with $40 monthly ARPU and 5 percent monthly churn, the expected lifetime is 1 divided by 0.05 equals 20 months, giving gross LTV of $800. Our subscription LTV tool (coming soon) handles this math; for now the calculator above works as a coarse approximation if you convert subscription revenue to AOV equivalent.
Seeing a retention problem?
Our growth strategy engagements include a cohort retention diagnostic. Fix the curve before scaling acquisition. Scoped quote in 48 hours.